I needed a non-emotional plan for my personal investing portfolio.
Fletcher Solved it. Here’s how to use it.
After experiencing a wide range of results and anxieties with my own investing style, I knew there had to be a better way. That started my quest to build Fletcher—an algorithm with easy to execute monthly signals, six or fewer holdings and a goal of stellar performance.
No special investing account—I use my own Fidelity account. ■
Three to six signals per month—no piles of data to pore through. ■
Designed to beat the S&P 500 Index—not by a little, but by a lot. ■
Friday Report
Get a quick glimpse into Fletcher by listening to the Friday Reports—each is only 5 minutes long and provides an overview of Fletcher’s performance this week.

Who is Fletcher?
Actually… What is Fletcher?
Fletcher is the algorithm I built and personally use to guide most of my investing decisions.
It’s a rule-based system I designed to direct when to buy, sell, and hold individual stocks—removing guesswork and reducing emotional decision-making.
Fletcher doesn’t try to predict the market. Instead, it follows a defined set of rules and executes them consistently—something many investors struggle to do over time—myself included.
Each month, the system analyzes a range of market and individual stock indicators then generates up to six trade signals to be executed on the first trading day of the month. In case you’re wondering, I keep the underlying methodology details to myself. It’s proprietary. However for context, Fletcher uses momentum indicators with added rules to minimize whipsawing. Two of three signals produce positive returns.
During my proof of concept testing, Fletcher produced an average annual return of about 80% (January 2018 through December 2025) with a compounding total return over 9,000%. This includes 2019 at 3% return. See Backtesting Results.
Yes—that number surprised me, too. That’s when Fletcher really grabbed my attention.
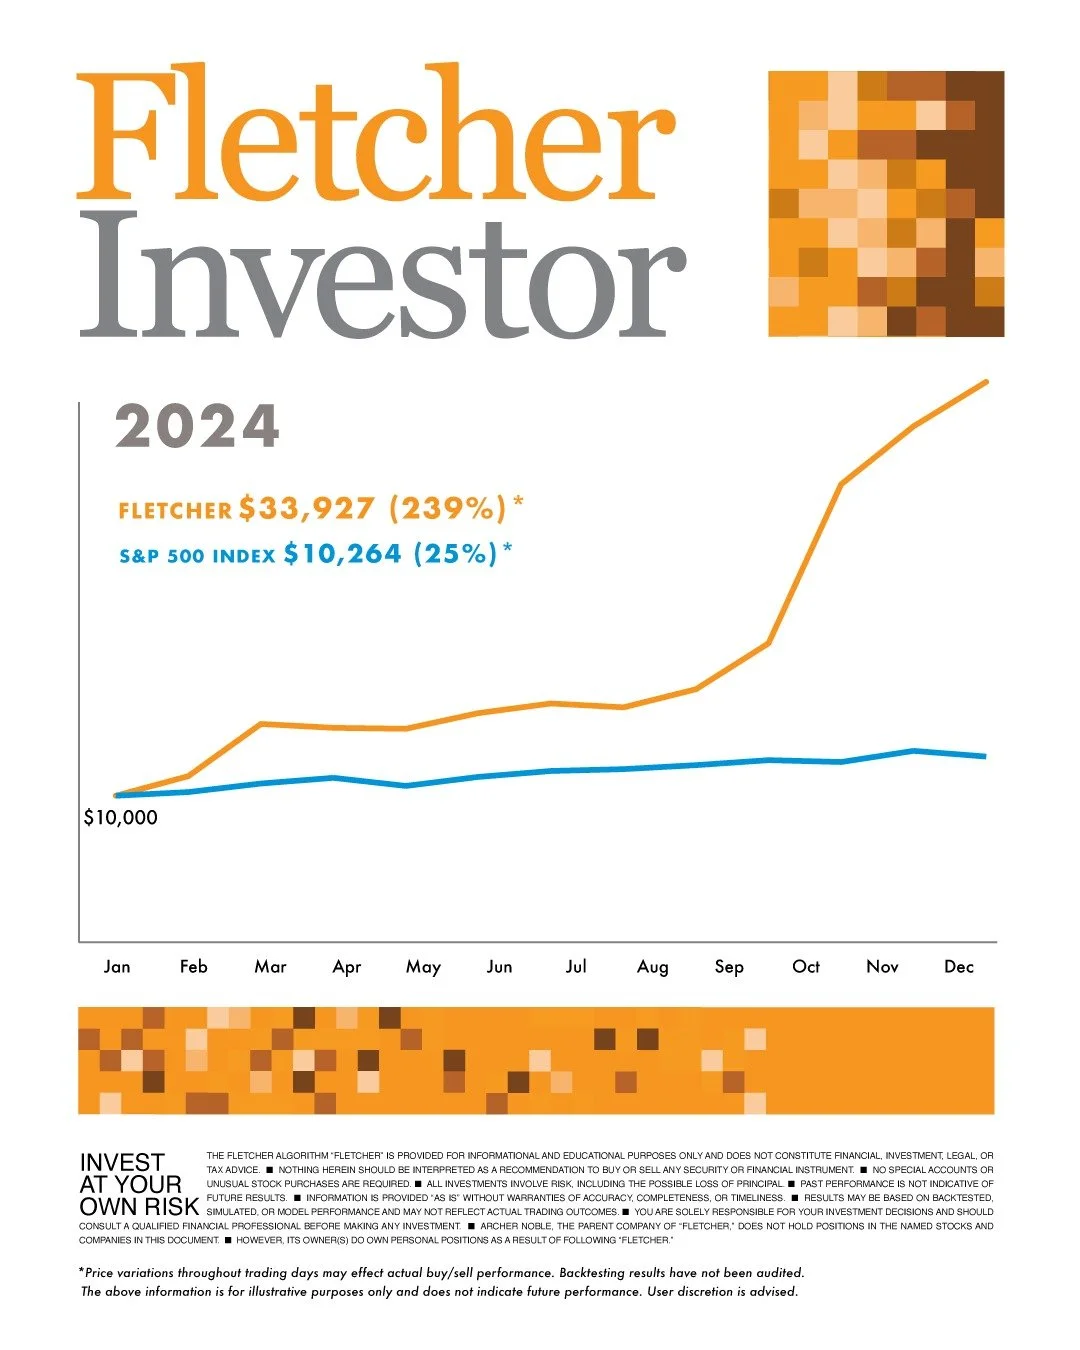
According to its historical signals, a $10,000 investment over the past three years (January 2023 to January 2026) would have grown to approximately $178,497. I wish I’d come up with Fletcher sooner.
Over that same period, an investment in an S&P 500 index fund would only be worth about $18,612.
What will Fletcher do going forward? No one knows.
But historically, its two-year rolling returns have outperformed the S&P by 20% or more. Often way more.
I’ve been investing using Fletcher since January 2026 within my own personal portfolio. I share the live results via the Friday Reports, a weekly podcast with the good, the bad and the ugly as it happens each week. I hope you'll come along to see how Fletcher performs.
Kyle
ps. As with any investing, there are no guarantees. I'm simply providing information for educational purposes. Invest at your own risk.
How It Works
Fletcher is simple by design.
Rather than chasing complicated strategies, obscure stocks, or constant trading, Fletcher focuses on a small portfolio of familiar, established companies and follows a clear set of rules.
■ Monthly Signals
Once each month, Fletcher evaluates the market and determines whether an identified stock should be bought, held, or sold.
■ A Concentrated Portfolio
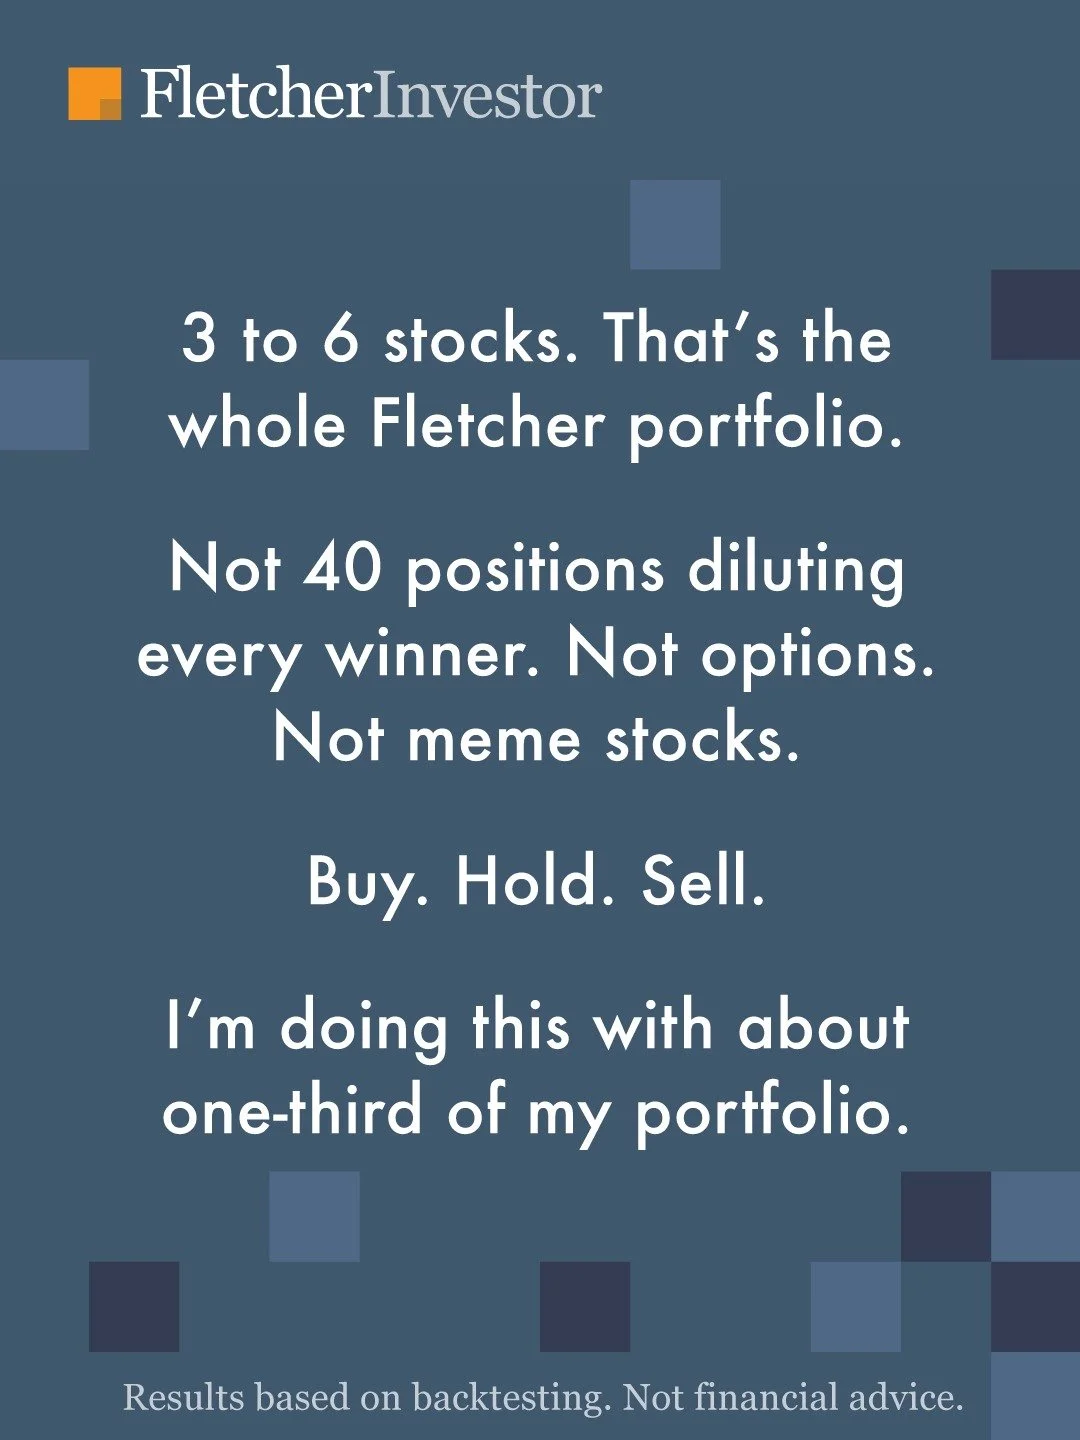
At any given time, Fletcher holds just 3–6 positions. The goal is to focus capital on the opportunities the algorithm identifies as most attractive rather than spreading it across dozens of holdings.
■ Familiar Companies
Fletcher selects well-known, established businesses—not speculative penny stocks, meme stocks, or companies you've never heard of.
■ No Complex Trading
No options. No puts. No calls. No short selling. No leverage.
■ Buy. Hold. Sell.
That's it. Fletcher follows a straightforward process: identify opportunities, hold them while the signal remains favorable, and exit when the signal changes. The objective is to remove emotion and complexity from investing and replace them with a consistent, rules-based approach.
Simple signals. Clear decisions. Disciplined investing. Designed to outperform the S&P 500 Index.
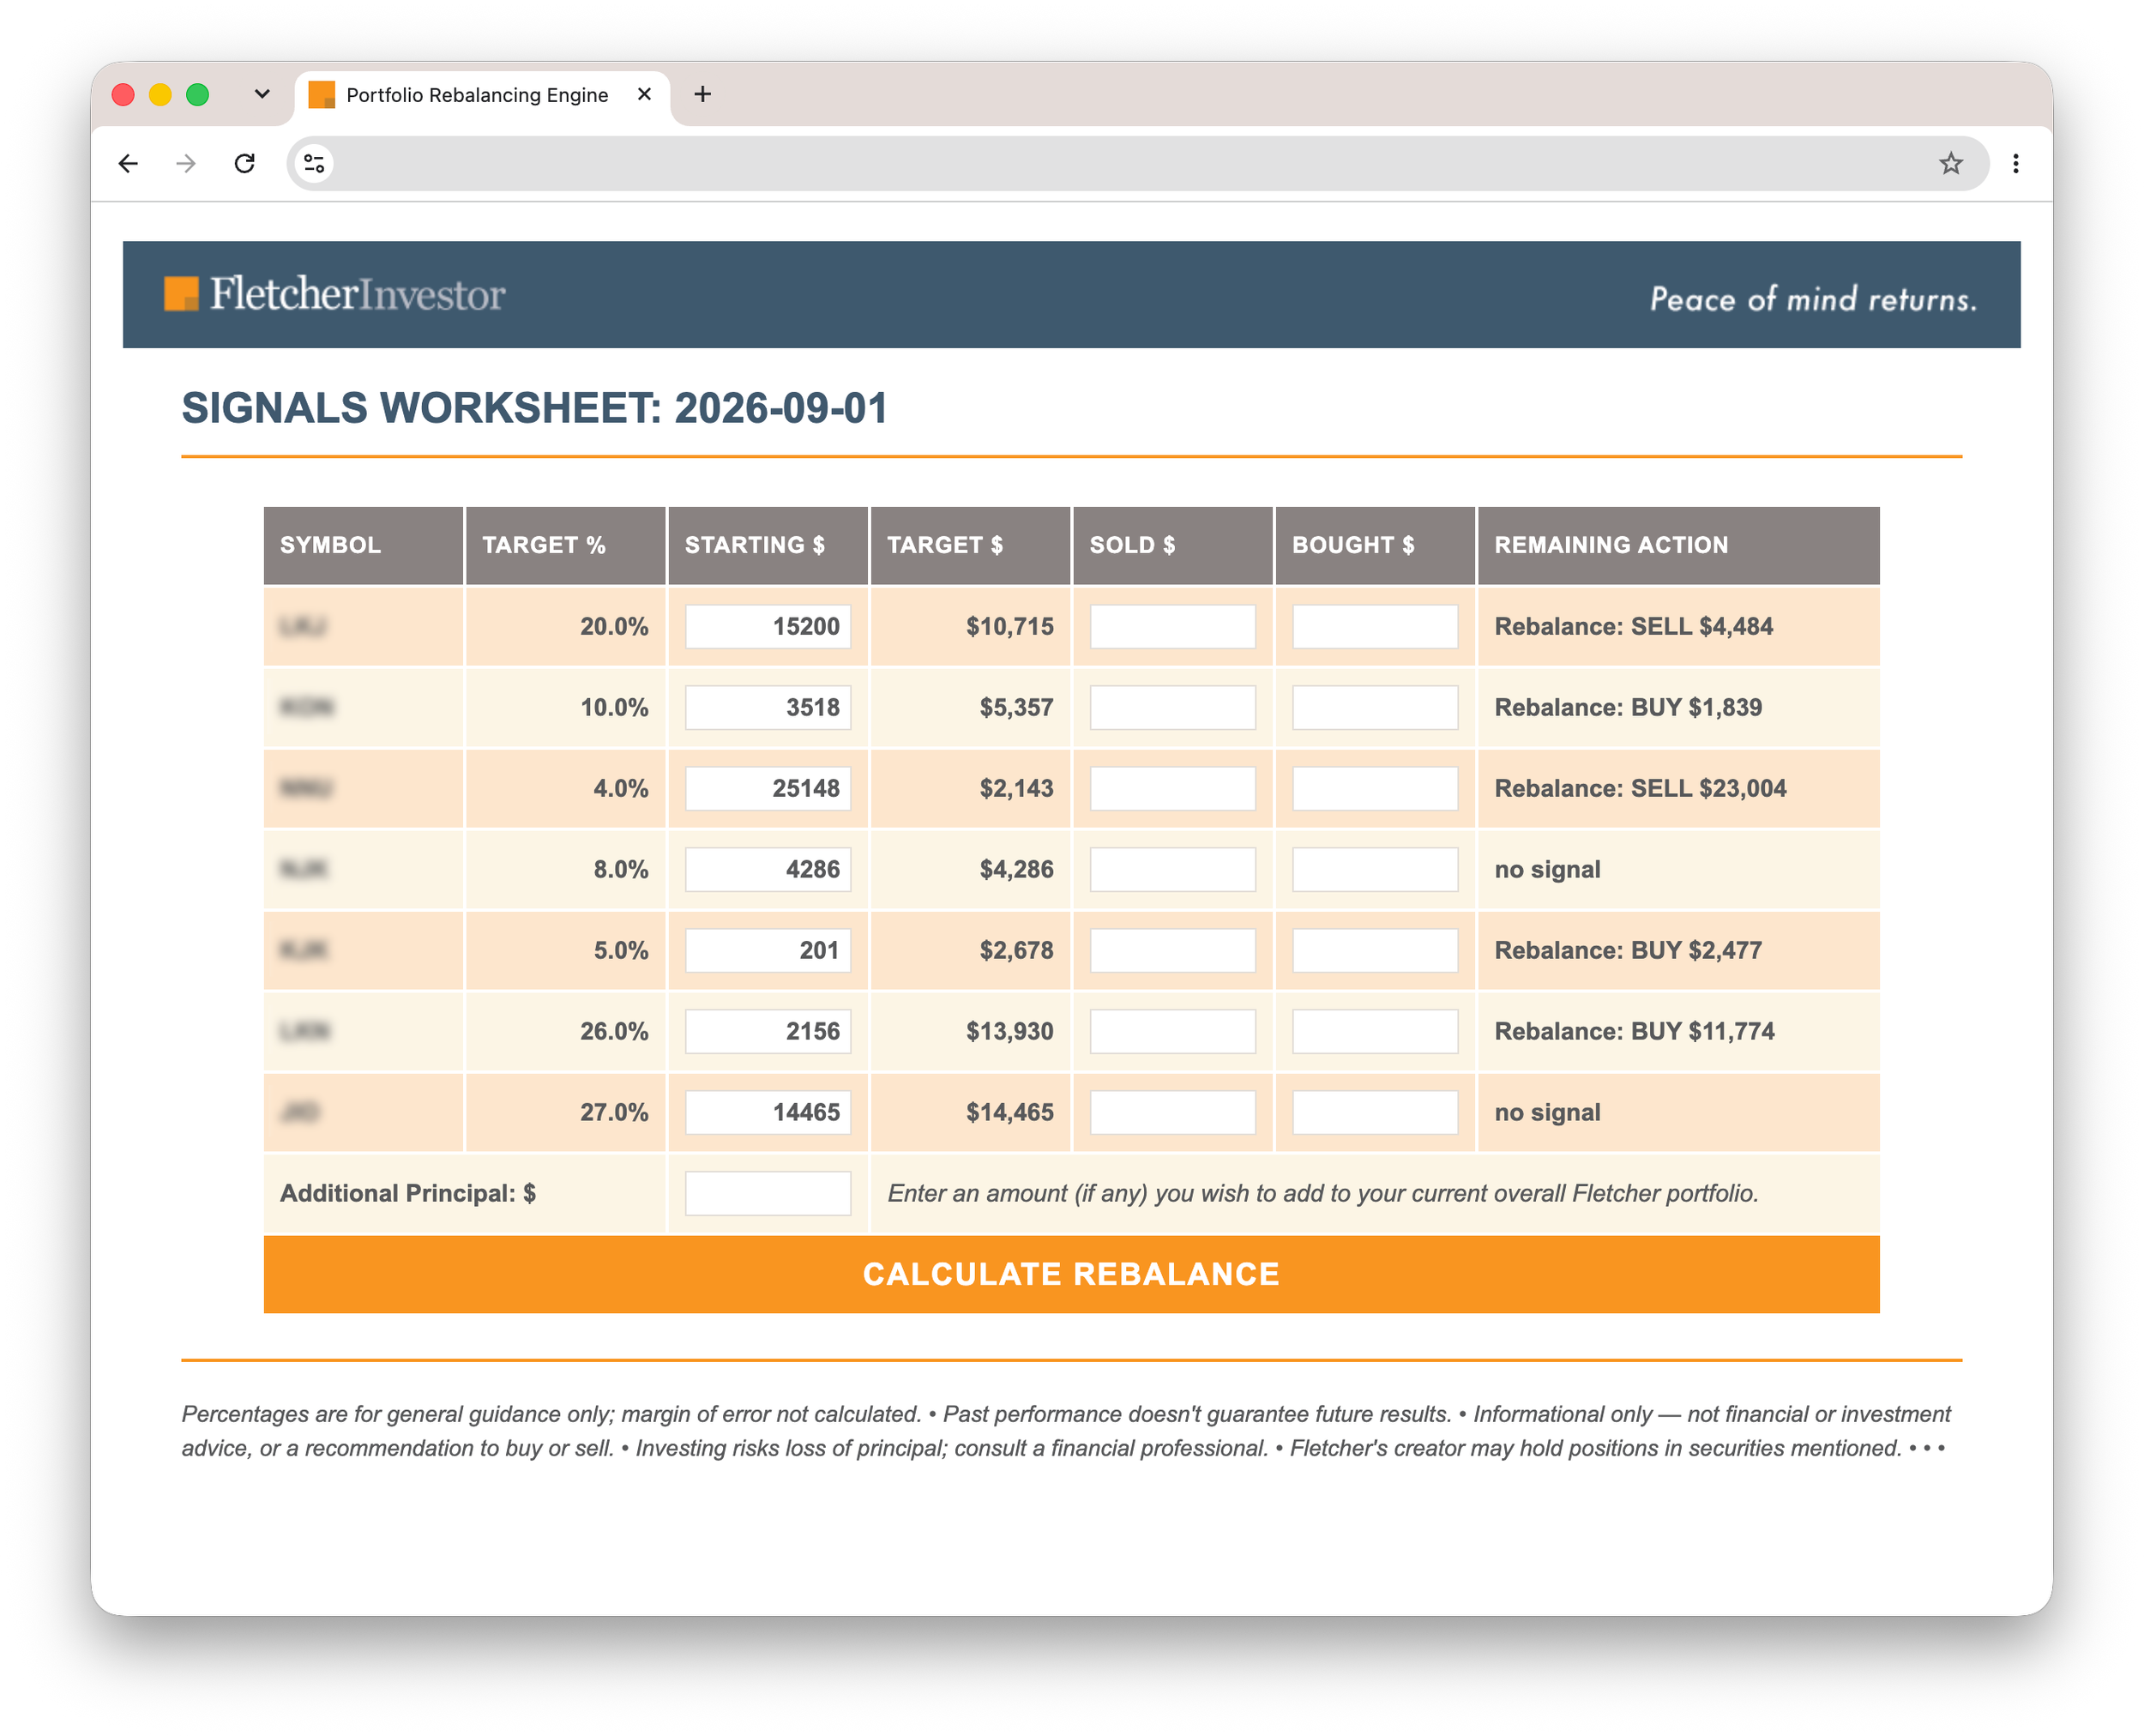
Example of monthly signal worksheet.
Each month subscribers receive an interactive worksheet with easy action items for applying the Fletcher signals.
Backtesting (and Live) Results
When testing my initial hypothesis, I saw the potential for something meaningful. The system showed compelling numbers—convincing me to dig deeper, including the inherent risks of backtesting.
There are aspects of backtesting where curve-fitting (or overfitting) can play a role, and some of Fletcher's backtesting will surely fall victim to this—something had to direct the thesis. However, a great deal of backtesting came after the conviction, after the rules, after the methodology, letting the established rules deliver whatever outcomes they may. I won't get into the specific rules here, since they're the mechanism behind the subscription. What matters is that a great deal of this testing was conducted blindly.
Across multiple market environments, Fletcher demonstrated the ability to outperform the broader market while following the same disciplined process month after month. Rather than reacting emotionally to headlines or market volatility, the system simply follows its rules and executes accordingly.
The historical backtesting results got my attention—enough that I began using Fletcher as a major part of my own investing approach in January 2026.
NOTE: Live data (as personally experienced in my own portfolio) continues to be strong for Fletcher. Prior backtesting results are being revisited after an errant rule was discovered. Initial findings show Fletcher’s volatility being elevated. To hear more about this and to stay up to date on weekly findings, listen to the weekly Friday Reports. Stay tuned for updated backtesting numbers and charts.
Live Performance
Live trading is the ultimate test for Fletcher over time, and I'll be tracking that transition from hypothesis to returns openly. The real unknown ahead is how Fletcher will perform when it eventually meets a bear market—something the live track record hasn't faced yet.
Year to date (as of August 1, 2026), 61% of Fletcher signals have produced a positive return over the prescribed holding period. This live result is consistent with backtesting. Since January, the average win has been 64% against an average loss of 12%. Fletcher's largest month-to-month drawdown to date has been approximately 26%, from a June 2026 peak to its July 2026 value.
Follow the live numbers via my Friday Reports by listening to the Fletcher Investor podcast.
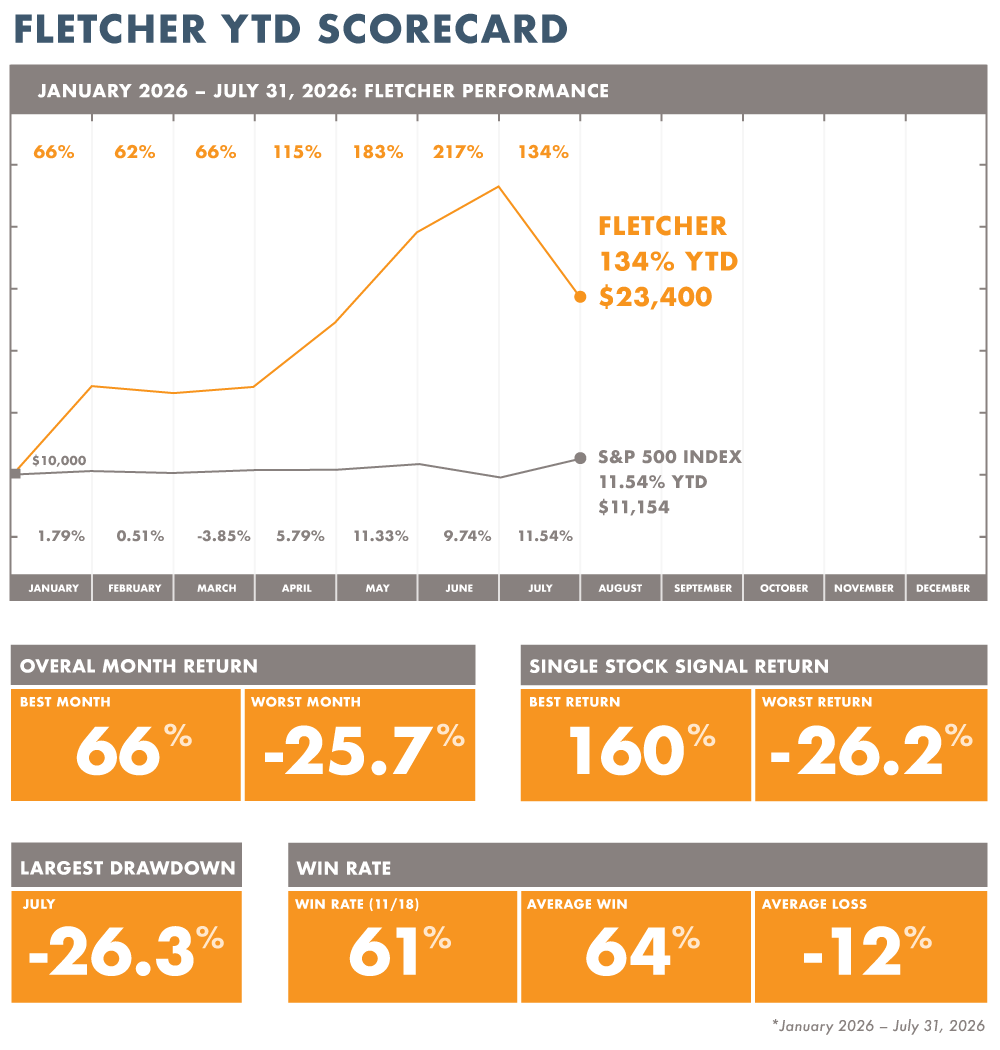
These figures are self-reported and have not been independently audited. • Returns are calculated using an intraday average price (the average of the day's high and low), which may differ from actual fill prices. • Fletcher's proprietary rules generate monthly buy, hold, and sell signals, evaluated on the first trading day of each month using that day's intraday average price. • Results shown for 2026 forward reflect signals generated and applied live, in real time — not retroactively calculated. • This information is provided for informational purposes only and does not constitute financial, investment, legal, or tax advice, and is not a recommendation to buy or sell any security.
Get Fletcher Investor
Monthly Signals
Fletcher memberships are currently unavailable.
Latest Podcast Episode
Follow on Instagram